Eye tracking in practice
Eye tracking which is the process of measuring the point of gaze, is a widespread research method enabling accurate monitoring of the visual efficiency of any internal space or screen, including virtual reality and games.
Its main benefit is that the results are unquestionable: you can precisely identify what drew the attention of the research participants and what they avoided altogether. Psychologists particularly like to use this method to gain insights and understand complicated cognitive processes. Another field that uses eye-tracking is marketing research, which analyses the effect of advertisements on attention.
Jakob Nielsen used this method in 2006 and found that in certain cases our gaze follows an F shaped pattern when reading web content. An even more important finding of Nielsen was that we don’t read every word, but instead scan the contents and pay more attention to the first sentences of a paragraph. If the users don’t find the information they are looking for within the first few paragraphs, they will leave the page. Same applies for Google search results.

The research conducted in 2006 was repeated and its supplemented explanation is also available online. The scanning methods used by the elderly are somewhat different. People aged 60+ often read the online content as if they were looking at a newspaper, but this also depends on how long they have been using Internet.
Available eye trackers
Studies of eye movement started in the early 1900s and the development of these devices went through multiple stages. Today several different types of eye-tracker devices exist, allowing us to identify eye movements and the attention of any given person, at any time and in any life situation. Researchers particularly like to use the Tobii eye-tracking system to research stores and other real world spaces and interfaces. This is because Tobii regularly develops both its product range and the support software. The eye tracker technology of Gazepoint allows you to conduct fairly accurate studies; one of their solutions not only offers gaze tracking, but also features study, including heart rate or galvanic skin reaction. These may be familiar aspects for those knowledgeable about the operation of lie detectors: they tell a lot about your current emotions.
The products of SensoMotoric Instruments (SMI) and LC Technologies also allow the conduction of accurate research. The scientific research conducted at magyarország.hu more than a decade ago was done with this very technology (article version published in 2009, scientific publication version). Some solutions such as Facial Action Coding System use eye-tracker technology together with a facial movement detector, a device detecting the physical expression of emotions.This device measures and analyses the movements of individual facial muscles and is able to recognize basic emotions to determine the emotional state of the research participant.

When analysing offline interfaces — for instance when testing the optimal layout of store interiors from the perspective of buyers, the “purchase-promoting” arrangement of goods or when researching the visual structure of advertisements placed in magazines or paper newsletters – researchers used to mount an eye camera on the head of the observer, but today all it takes is feather light eyeglasses. Both Tobii and Gazepoint manufacture such eyeglasses.


These devices enable the studied individuals to behave almost entirely natural in any outdoor or indoor space and they enable the researchers to understand what buyers say about the positioning of a given product on the shelf or whether they notice a billboard and how their gaze and attention wanders. Screen interfaces (computer, laptop, tablet, mobile) can be tested with other devices to understand the behaviour, the perception, the attention and the interest of the participants. In such cases the system uses cameras mounted underneath the screen instead of glasses. These cameras are so well concealed on the most cutting-edge devices that the research participant doesn’t even notice them.
What are the results and how do you use them?
The system can create various overview images enabling the researcher to determine the efficiency of the visual interfaces, the viewing sequence of the interface and also which graphic and visual components drew the most attention on the given interface and whether there were any areas which the research has neglected altogether. Once the testing is done, a graphical matrix is created containing a large set of data. If several people look at the same interface, the system is able to average the results in different ways. Fixations (a series of short stops) and quick saccades of the eyes are captured by scan-path analysis images [in case of fixations the system measures how long we look at something and in case of saccades the system observes how our gaze is wandering (quickly jumping) between the fixations] – while the degree of attention is presented by the opacity map and the hotspot maps. Scan-path analysis images indicate the sequence of the fixations and the duration of the individual fixations. The obtained test results can be displayed in summary form as aggregated data.


The software of the eye tracking device analyses the duration of the gaze spent on the various details of the picture. Using these data the program determines the attention level and hotspot images expressing the degree of visual attention. You can also display the degree of visual attention using hotspot images. These hotspot images use different colours to indicate the areas attracting the most attention and also show the areas neglected by the testers when looking at the interface. By comparing the obtained results you can also test which one of the images and arrangements is the most efficient. The images of the focus map represent what exactly drew the participants’ attention on the interface. In general the human face and especially the eyes are considered a source of visual information that nothing can surpass. In human communication the direction of the gaze carries significance . Research shows that when looking at a picture, we either look into the eyes of the person appearing in it or at the object that the person is looking at.

It has also been observed that women pay more attention to the environment.

How to design an eye-tracking research study?
Preparing and conducting an eye-tracking research study is done similarly to any other research, however it requires more sophisticated devices. Whether you want to test offline or online interfaces, makes a difference and you need to decide in advance whether you want to analyse the obtained hotspot images one by one or you’d want to use the aggregated images for the analysis as well.
A tiny but very important research aspect is that hotspot images qualify as qualitative research when analysed one by one, but as quantitative research when they are aggregated and so different sample sizes are needed. It is basically enough to test 5-8 participants, but to obtain aggregate data we need more participants, 39 to be exact. No matter which approach you adopt, it will be impressive and useful, but the quality of the research will be better if you pay attention to this aspect.
In case of eye-tracking, it is particularly important to invite more participants for the test since you may not be able to conduct the test with all of them. Fortunately this is less and less likely to happen since the technology is constantly evolving. Special ophthalmic and multifocal eyeglasses may be disturbing and in such cases the machine is unable to properly calibrate the eye.
If the interface to be designed will be used by very different type of users, you should invite the adequate number of participants from each group for the test, and segment the research results later on by user groups. The software accompanying the device is perfectly suitable for that: it is able to generate and present the results based on various aspects, such as age and gender. This is especially important if (currently) individuals aged 60+ also belong to the target group, because according to research results this age group uses the online interface differently than middle-aged and especially young people. They have more difficulties understanding icons and are less keen on varied page layout and prefer stability, and as we mentioned earlier, their online scanning strategy is the same as the one used when reading an offline newspaper. So the 60+ age group is becoming an increasingly important target group as our society is gradually growing older. The Internet usage habits of the aging society are also changing, so it is worthwhile to do research and study them constantly.
So now you have the colourful images: what to do with them?
How to analyse them?
As you could see, eye tracking software can be used to take many different types of overview images for your research, enabling you to perform even fairly complex analysis. Not only the colourful spots on the interface are relevant but also where the users looked for the information for the first and second time, and what path their gaze followed while searching for a specific information. It is also important that the wandering of the gaze is not on its own, it is always related to some actions, so you must take into account what the current task of the participants was when analysing the results. If you omit this consideration you could easily come to a false conclusion.
Another important data is to determine when the participant’s gaze returned to a specific component on the interface. If it has happened on several occasions, it is worthwhile to talk briefly with the test participants about their experiences. Although no one is able to recall their eye movements but you could obtain useful information by discussing and analysing together what they saw.
Their goal or motivation while viewing the given interface, the content of the page, its graphical layout or how familiar the user is with the page also make a difference. It also matters whether the users know similar interfaces and whether they have any preconceived ideas and expectations (mental model) about what and where to find.

Concluding thoughts
Eye-tracking research is a method yielding extremely impressive results by accurately recording the gaze. It allows us to identify the parts of the interface that hold the attention of the visitors. Previous research results and individual interviews can clarify the underlying reasons.
As with any research, it is suggested to consider up front which aspects of the results you are interested in when designing the research plan. It is recommended to compile the research scenario based on these aspects and select the participants (including the number of participants and their demographic composition) accordingly. If you are only interested in qualitative data, it is enough to have fewer participants, but in case of averaging you will need a higher number of participants. During the analysis process you should never forget what the task of the participants was when viewing a given interface.
This is what will turn the nice colourful images into real and usable research results.
About the authors
Related case studies
Prefixbox
Prefixbox is a Hungarian e-commerce scaleup. We helped them design an AI agent that gives more accurate product recommendations to shoppers with generative AI.

Percapita
We designed a full-fledged application for simplifying everyday finances.
Atmen Fintech
Mobile App
Designing a Minimum Viable Product for a Diaspora Neobank Startup
Sterling Archer
By applying the DDD framework, we created multiple digital tools for a US based Data Company.

Ergomania and NGOs in the Netherlands
UX design for Fintechs, banks and financial startups is the everyday work of Digital Product Design company, Ergomania based out of Budapest, Hungary.

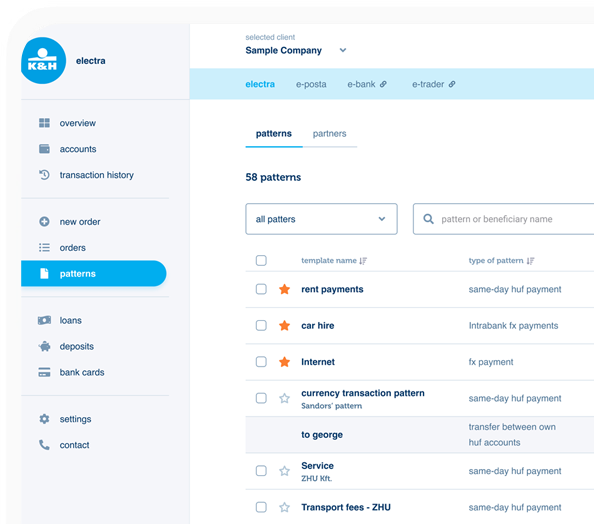
K&H Bank's Corporate Netbank
The K&H Electra Netbank App consolidates all financial needs into a single, user-friendly application. With its intuitive design, businesses can effortlessly manage their company's cash flow, transactions, and investments from one centralized hub.
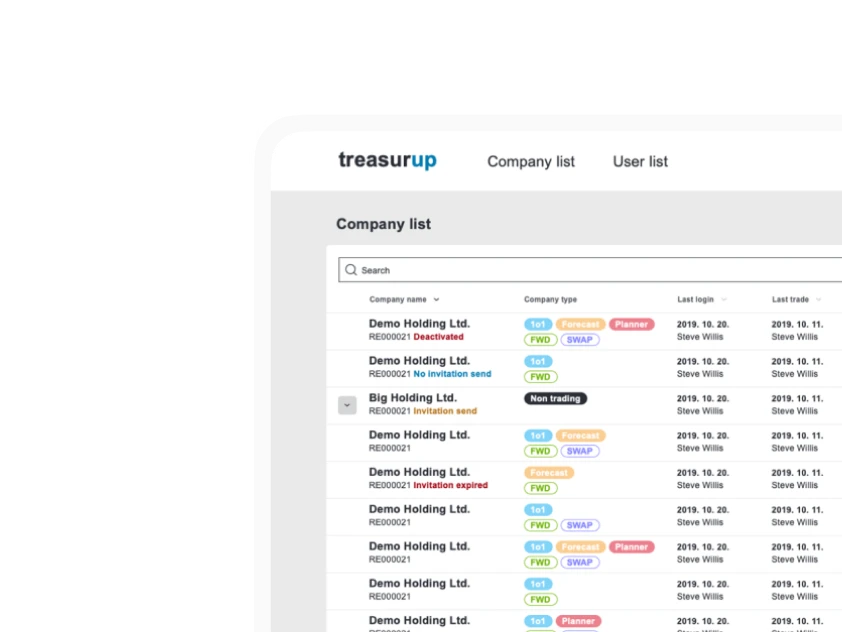
TreasurUp
We established written and visual consistencies and guidelines for TreasurUp’s financial platform.
Simple by OTP
Simple by OTP Bank is Hungary's No.1 mobile payment app for cashless payments with 1M+ downloads, and 1 million+ transactions.
White Label Banking App
We provide full-blown next-generation mobile banking solutions for sales-oriented banks.
Want to read more
about UX, fintech and banking?
Subscribe to our biweekly newsletter and get the latest of our news and thoughts!