How to Measure UX ROI and Prove its Business Impact
Good user experience (UX) is fundamental for a successful digital product. However, it's not enough for something to work well or look good on its own – it must also demonstrate that the work invested in UX brings concrete, measurable business benefits, making the investment worthwhile. Proving the return on investment (ROI) of UX, however, can often be a serious challenge. How can we move beyond subjective opinions and use data to show that UX improvements truly bring tangible business benefits?
UX guru Vitaly Friedman shared an interesting point on LinkedIn: how to move away from NPS (Net Promoter Score, willingness to recommend) toward a more complex measurement that better expresses results in measuring UX success. Although NPS is perhaps one of the best-known and most widely used metrics for measuring UX, it has recently faced increasing criticism, especially in product development and UX design.
 What people say and what they actually do often differ (created with MidJourney)
NPS works with the question of how likely someone is to recommend a given product or service to a friend or colleague on a scale of 0 to 10. However, Friedman highlights the simple fact that what people say and what they actually do often differ. Assuming that if someone likes a product, they will also recommend it to others, is not always correct. It might be something that people are not keen to recommend (e.g., a hygiene product), or there might be no one in their circle who currently needs it (e.g., an app meeting a specific professional need). Moreover, the NPS score itself doesn't provide very useful feedback: if it's low, it indicates a problem, but it doesn't specify what the problem is or how to fix it.
Beyond NPS: Why is More Comprehensive Measurement Needed?
Friedman's critique highlights a fundamental issue: a single metric (or a few) cannot provide a complete picture of the complexity of user experience, let alone its business impact. NPS, for example, can be useful for measuring customer loyalty (or rather, a certain aspect of it), but it doesn't provide information on many things, such as *how* people use the product, what problems they encounter, or the specific impact of UX changes.
Obviously, knowing whether users would theoretically recommend a product is not enough to demonstrate UX ROI (return on investment). We need to understand how UX influences conversion, retention, and efficiency – and through these, ultimately, the company's financial results. The Interaction Design Foundation, in its detailed summary, emphasizes the fundamental role of KPIs (Key Performance Indicators) in defining UX goals and tracking progress. However, NPS and similar simplistic metrics are too general to adequately fulfill this role.
The Strategic Importance of UX Measurement
To truly understand and prove the business impact of user experience, a more thorough, strategic approach to measurement is necessary. But why is such in-depth UX measurement so crucial, and why must we move beyond superficial indicators?
- More Objective Decisions, Less Guesswork: Regular, data-driven measurement helps filter out personal opinions and biases. This allows us to make decisions based on facts rather than intuition.
- Products, Not Just Checked-Off Tasks: Thorough measurement helps ensure the focus is not just on delivering features, but on creating real value for users and the business. This way, we can direct our resources to developments that truly matter.
- Strong Arguments and Better Internal Communication: Data from UX measurements provide concrete evidence to support design decisions when communicating with various stakeholders. Clear numbers make it easier to convince others, simplifying internal discussions.
- Provable Business Impact and ROI: When we can demonstrate with numbers how a UX improvement has increased revenue or reduced costs, UX clearly becomes an important tool for achieving strategic goals.
The Basics of UX Measurement: Why and How to Measure?
If we genuinely want to deeply understand user experience and its business impacts, we need multiple KPIs that examine different aspects of UX. These indicators provide us with data that allows us to move beyond general impressions to concrete, practical steps. So, let's look at the important KPI categories and metrics that can help us measure and understand user experience more accurately:
How Easy Is It for the User? Effort and Perceived Ease
These metrics focus on how smoothly and easily users can accomplish tasks or get things done.
- Customer Effort Score (CES): CES measures how much effort a user had to exert to complete a specific task (e.g., solving a problem, making a purchase). We usually ask a simple question after completion, such as, "How easy was it to solve your problem?". Less effort generally means more satisfied and loyal customers, as users appreciate not having to struggle unnecessarily.
- Single Ease Question (SEQ): The SEQ is a very targeted, single-question metric. Typically, we ask the user immediately after a specific task: "How easy was it to complete this task?" (usually on a 7-point scale). Its strength is that it provides immediate, context-specific feedback, painting an accurate picture of the perceived difficulty of an interaction.
How Much Do They Like It? Usability and Overall Satisfaction
These indicators assess the overall quality, usability, and users' general impression of the product or service.
- System Usability Scale (SUS): SUS is a widely used 10-question questionnaire that quickly and reliably measures the perceived usability of a system. The resulting score, between 0 and 100, provides a comprehensive view of usability, and many benchmark data are available to evaluate our own results. According to the Interaction Design Foundation, the average SUS score is 68; anything higher indicates above-average usability.
- UMUX-Lite (Usability Metric for User Experience - Lite): A shorter, two-question version of SUS that also measures perceived usability and usefulness. Being quick, it's very good for regular measurements or comparing the results of A/B tests.
- Customer Satisfaction (CSAT): Although not solely a UX metric, CSAT provides important feedback on how satisfied users are with a specific interaction or the product as a whole, usually rated on a simple scale (e.g., 1 to 5).
What Are They Actually Doing? Behavior-Based Metrics
 Measure what users do in the system, how successfully they complete tasks (created with MidJourney)
These KPIs measure what users do within the system and how successfully and efficiently they complete tasks important to them.
- Task Success Rate (TSR): One of the most fundamental UX metrics. It shows the percentage of users who can successfully complete a predefined task. A low TSR clearly indicates problematic points in user journeys.
- Levels of Success: A more precise version of TSR. It not only looks at whether the task was successful or not but also whether assistance was needed or if there were minor or major issues. This gives a more accurate picture of the severity of usability problems.
- Time on Task (ToT): Measures the average time users take to complete a task. Shorter times usually mean better efficiency, but this also depends on the situation: for a more complex task, longer times might be acceptable if it helps in better understanding and thoroughness.
- User Error Rate (UER): Measures how often and what types of errors users make during a task. Many errors, or frequently recurring specific errors, can indicate serious design flaws.
How Does UX Affect the Business? Analytical Metrics
This data, typically from web or product analytics systems, shows a direct link between user behavior and business results.
- Conversion Rate: The percentage of users who complete a desired business goal (e.g., purchase, registration). This is one of the metrics through which UX can most directly generate revenue.
- Abandonment Rate: Drop-off measured at critical points (e.g., shopping cart or registration form). A high rate can indicate significant revenue loss and poorly designed processes.
- Retention Rate / Churn Rate: Shows the proportion of users who remain active or leave the service within a given period. Good UX is crucial for keeping customers long-term and maximizing their value (Customer Lifetime Value - CLV).
- Daily/Monthly Active Users (DAU/MAU): Shows how "sticky" the product is, i.e., how much it engages users.
- Feature Adoption Rate: Measures how much users start using a new or existing feature and incorporate it into their daily routines.
The Impact of UX on Company Operations and Costs
UX improvements can positively affect not only external users but also the company's internal operations and costs.
- Support Ticket Volume: If a product is user-friendly and easy to use, users will have fewer problems with it. This reduces the number of customer service inquiries, directly leading to cost savings.
- Reduced Development Rework: Identifying and fixing problems early in the development process through UX research and testing prevents more expensive fixes that would otherwise be needed later or post-launch.
Numbers and Whys: Quantitative and Qualitative Data Together
It's important to understand that the above number-based (quantitative) metrics often only answer "what is happening" (e.g., what users are doing, where they get stuck). To get answers to the "whys" (e.g., why they get stuck, why they are frustrated), it is essential to also collect qualitative data.
User interviews, observations during usability tests, and responses to open-ended questions help to better understand the situation and the correlations. The two types of data together provide the most complete picture, and actions can be best determined based on them.
Feedback Scoring and Gap Analysis
It's worth mentioning another practical method: feedback scoring and its associated gap analysis. This method builds on collecting feedback about users' specific past experiences. Users rate their agreement with several important statements regarding the product experience (e.g., "The product's capabilities meet my needs.") typically on a scale. By averaging and plotting these scores (perhaps on a spider diagram), it becomes clear which areas of the product are good and where improvements are needed.
Gap analysis then examines the difference between current performance and a predetermined target (e.g., achieving a higher score). This method not only helps in finding problematic areas but also provides concrete, measurable goals for development and can be very well supplemented with qualitative research to understand the reasons behind the numbers. This is a simple yet effective way to determine what constitutes successful design and to improve it over time.
The Art of Connecting UX Metrics and ROI
Having the right tools to measure user experience is just the beginning. The real big step is when we can connect these UX metrics with the company's actual business results and calculate the return on money spent on UX. But how do better UX metrics translate into concrete business benefits? The connection is visible in several areas:
Revenue Growth
- Better conversion rates – which can be achieved, for example, by improving the task success rate (TSR) or reducing the user error rate (UER) in important processes (like purchasing or registration) – directly mean more sales or leads.
- If the UX is better, making it easier to navigate product offers and simpler to purchase, it can increase the average order value (AOV).
- If more people use features (feature adoption rate, FAR), it can help sell premium services, or users might love the product so much that it generates revenue later.
Cost Reduction
- Through lower UER and better TSR, users face fewer problems, which can drastically reduce the number of customer service inquiries and associated costs.
- Identifying and fixing usability issues early in the development cycle through UX research and testing significantly reduces the need for costly development rework.
- For internal company tools, a decrease in time on task (ToT) means direct cost savings.
Increased Customer Retention and Loyalty
 A more positive UX demonstrably strengthens customer loyalty (created with MidJourney)
- A more positive user experience demonstrably strengthens customer loyalty. This can be measured, for example, by higher customer satisfaction (CSAT) or usability (SUS) scores, more successful onboarding completion rates (OCR), and more favorable customer effort scores (CES).
- This, in turn, directly contributes to a reduction in churn rate and an increase in customer lifetime value (CLV).
Methods like the Google HEART (Happiness, Engagement, Adoption, Retention, Task Success) framework or the GEM (Goals, Engagement, Metrics) model can also help in aligning UX measurement with business goals. These methods assist in thoughtfully selecting UX metrics that already align with larger business objectives, making it easier and clearer to show how they connect to ROI.
From Plans to Actions: Practice and Results
Understanding how to link UX metrics with business ROI is good, but real value is created when this knowledge is applied in practice, fostering a company culture where measurement is data-driven. This requires foresight and persistent effort. Firstly, it's important to select KPIs that align with our goals: we shouldn't try to measure everything, only those indicators most relevant to current business and product objectives.
Next comes establishing baselines and continuously monitoring the selected KPIs to see the impact of our changes. It's crucial to always measure appropriately for the situation; for example, a CES or SEQ questionnaire immediately after a task, within the product, provides the most useful, immediate feedback. Finally, the clear communication of results is vital: the UX team must be able to convey data and insights in the language of business, so decision-makers understand their impact on revenue, costs, or customer retention.
However, the impact of UX measurement is more than just aiding product development decisions; it benefits the company on multiple levels. The entire company can learn from regular, data-driven feedback, and everyone can better understand user needs across different areas. When UX results are numerically reflected in business successes, it increases others' commitment to UX and elevates the importance of this field. In the long term, a culture of measurement develops throughout the company, where user-centric decisions are not just random but part of daily work. This approach also supports the continuous development of UX research and design within the company, enhancing UX maturity.
About the authors
Balázs has been working in content for more than 20 years, having the role as an editor at one of the first and largest news sites, later helping to establish the content marketing business for media publishers and agencies. Today, Balázs serves as content producer at Ergomania Ltd.
Related case studies
Prefixbox
Prefixbox is a Hungarian e-commerce scaleup. We helped them design an AI agent that gives more accurate product recommendations to shoppers with generative AI.

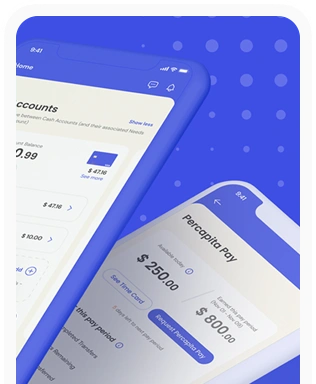
Percapita
We designed a full-fledged application for simplifying everyday finances.
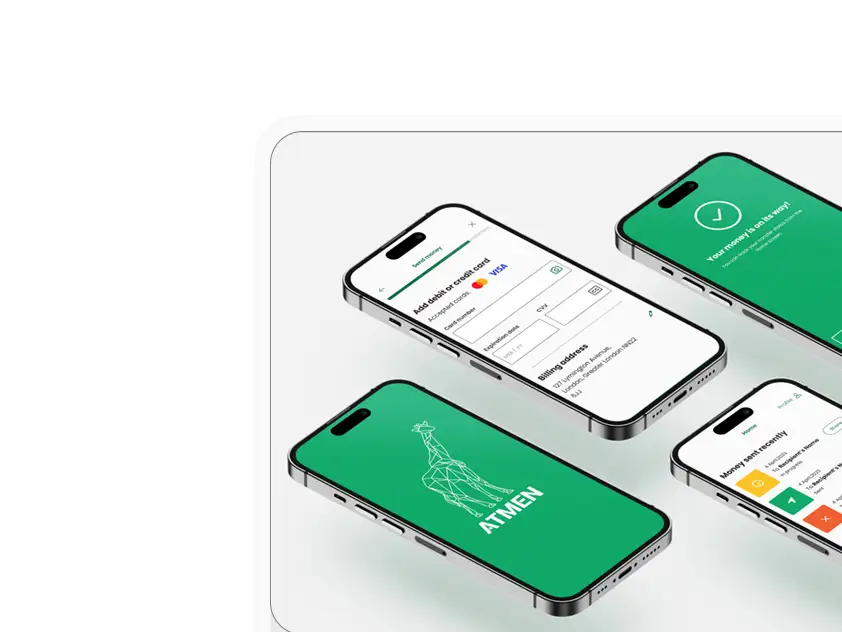
Atmen Fintech
Mobile App
Designing a Minimum Viable Product for a Diaspora Neobank Startup
Sterling Archer
By applying the DDD framework, we created multiple digital tools for a US based Data Company.

Ergomania and NGOs in the Netherlands
UX design for Fintechs, banks and financial startups is the everyday work of Digital Product Design company, Ergomania based out of Budapest, Hungary.

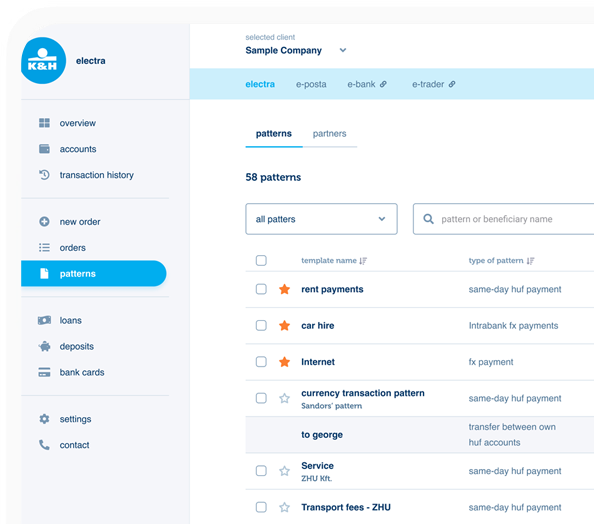
K&H Bank's Corporate Netbank
The K&H Electra Netbank App consolidates all financial needs into a single, user-friendly application. With its intuitive design, businesses can effortlessly manage their company's cash flow, transactions, and investments from one centralized hub.
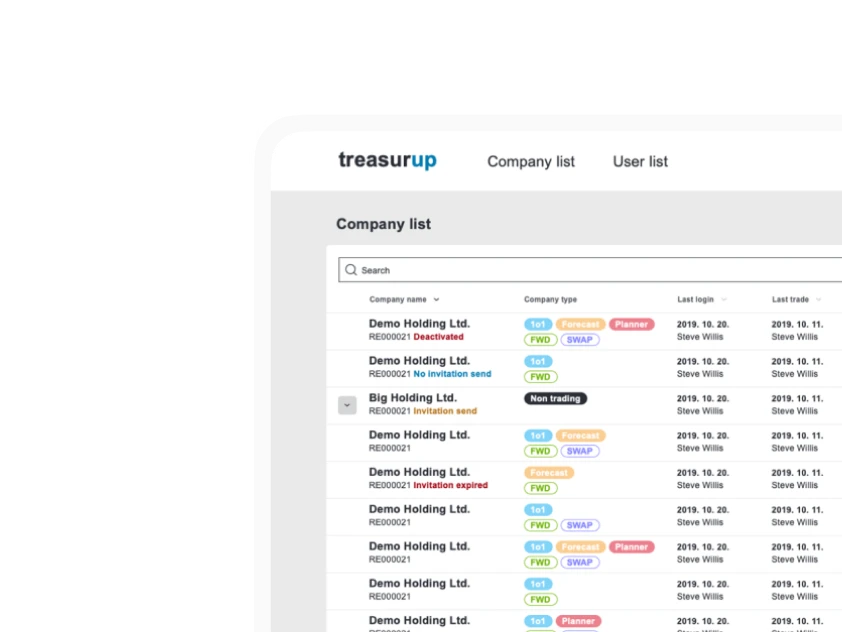
TreasurUp
We established written and visual consistencies and guidelines for TreasurUp’s financial platform.
Simple by OTP
Simple by OTP Bank is Hungary's No.1 mobile payment app for cashless payments with 1M+ downloads, and 1 million+ transactions.
White Label Banking App
We provide full-blown next-generation mobile banking solutions for sales-oriented banks.

Want to read more
about UX, fintech and banking?
Subscribe to our biweekly newsletter and get the latest of our news and thoughts!